Manage Indexes
You can perform certain index management tasks through the Couchbase Cloud UI.
Access the Cluster Indexes View
If a cluster is running the Index Service, indexes can be viewed under the cluster’s Advanced > Indexes tab.
-
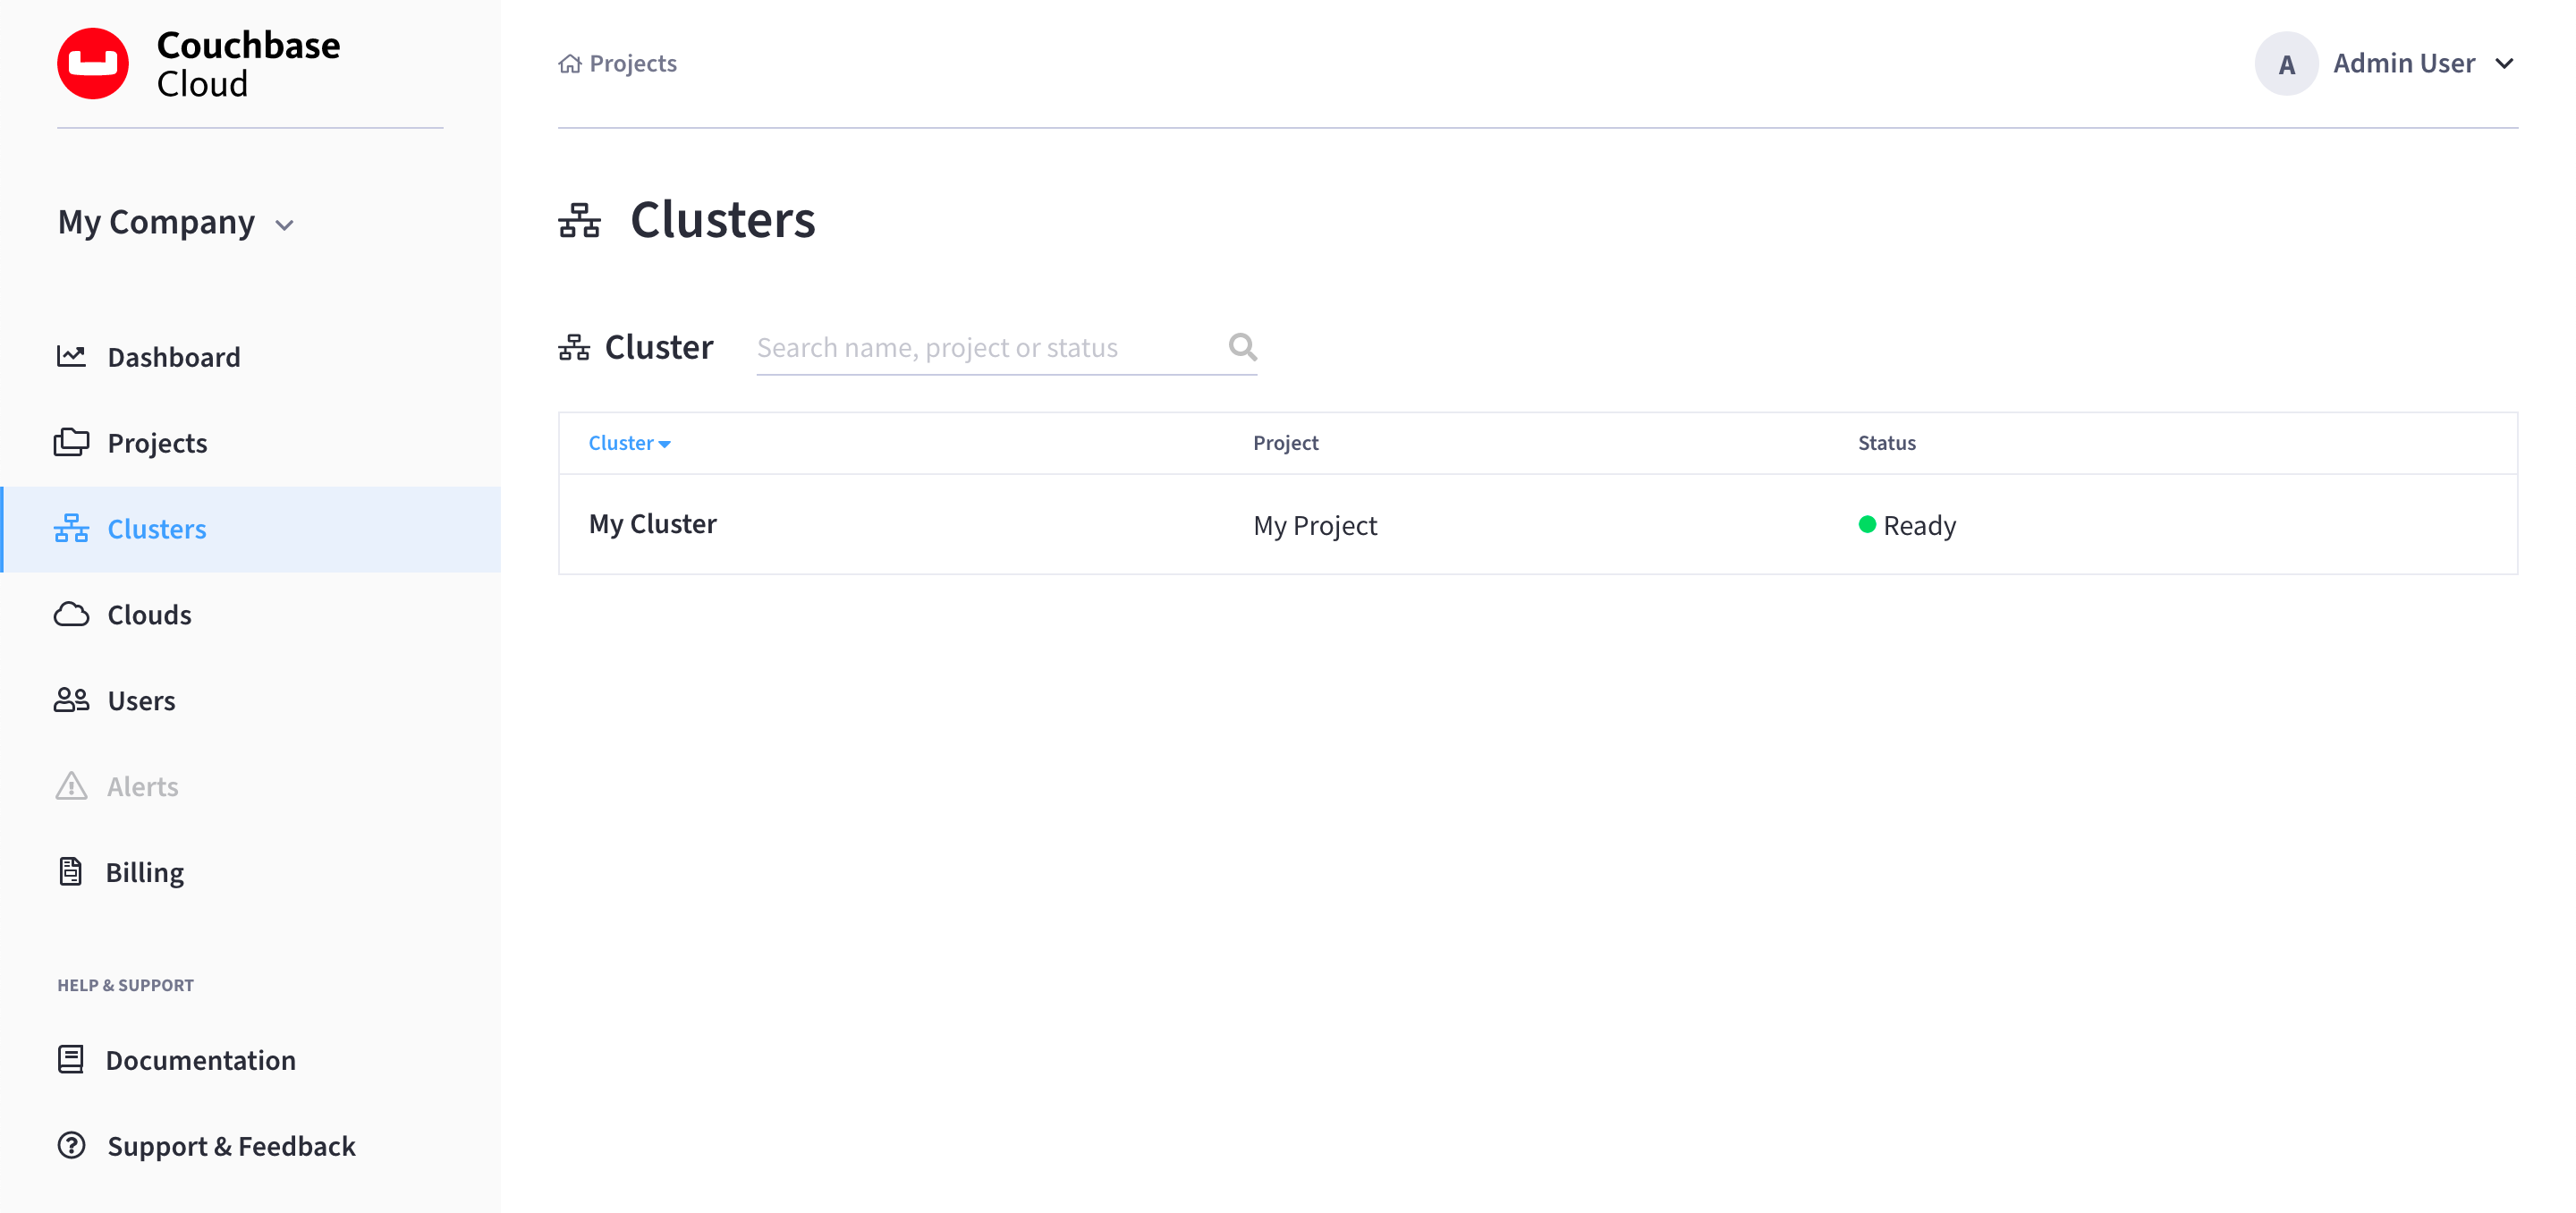
Go to the Clusters tab.
-
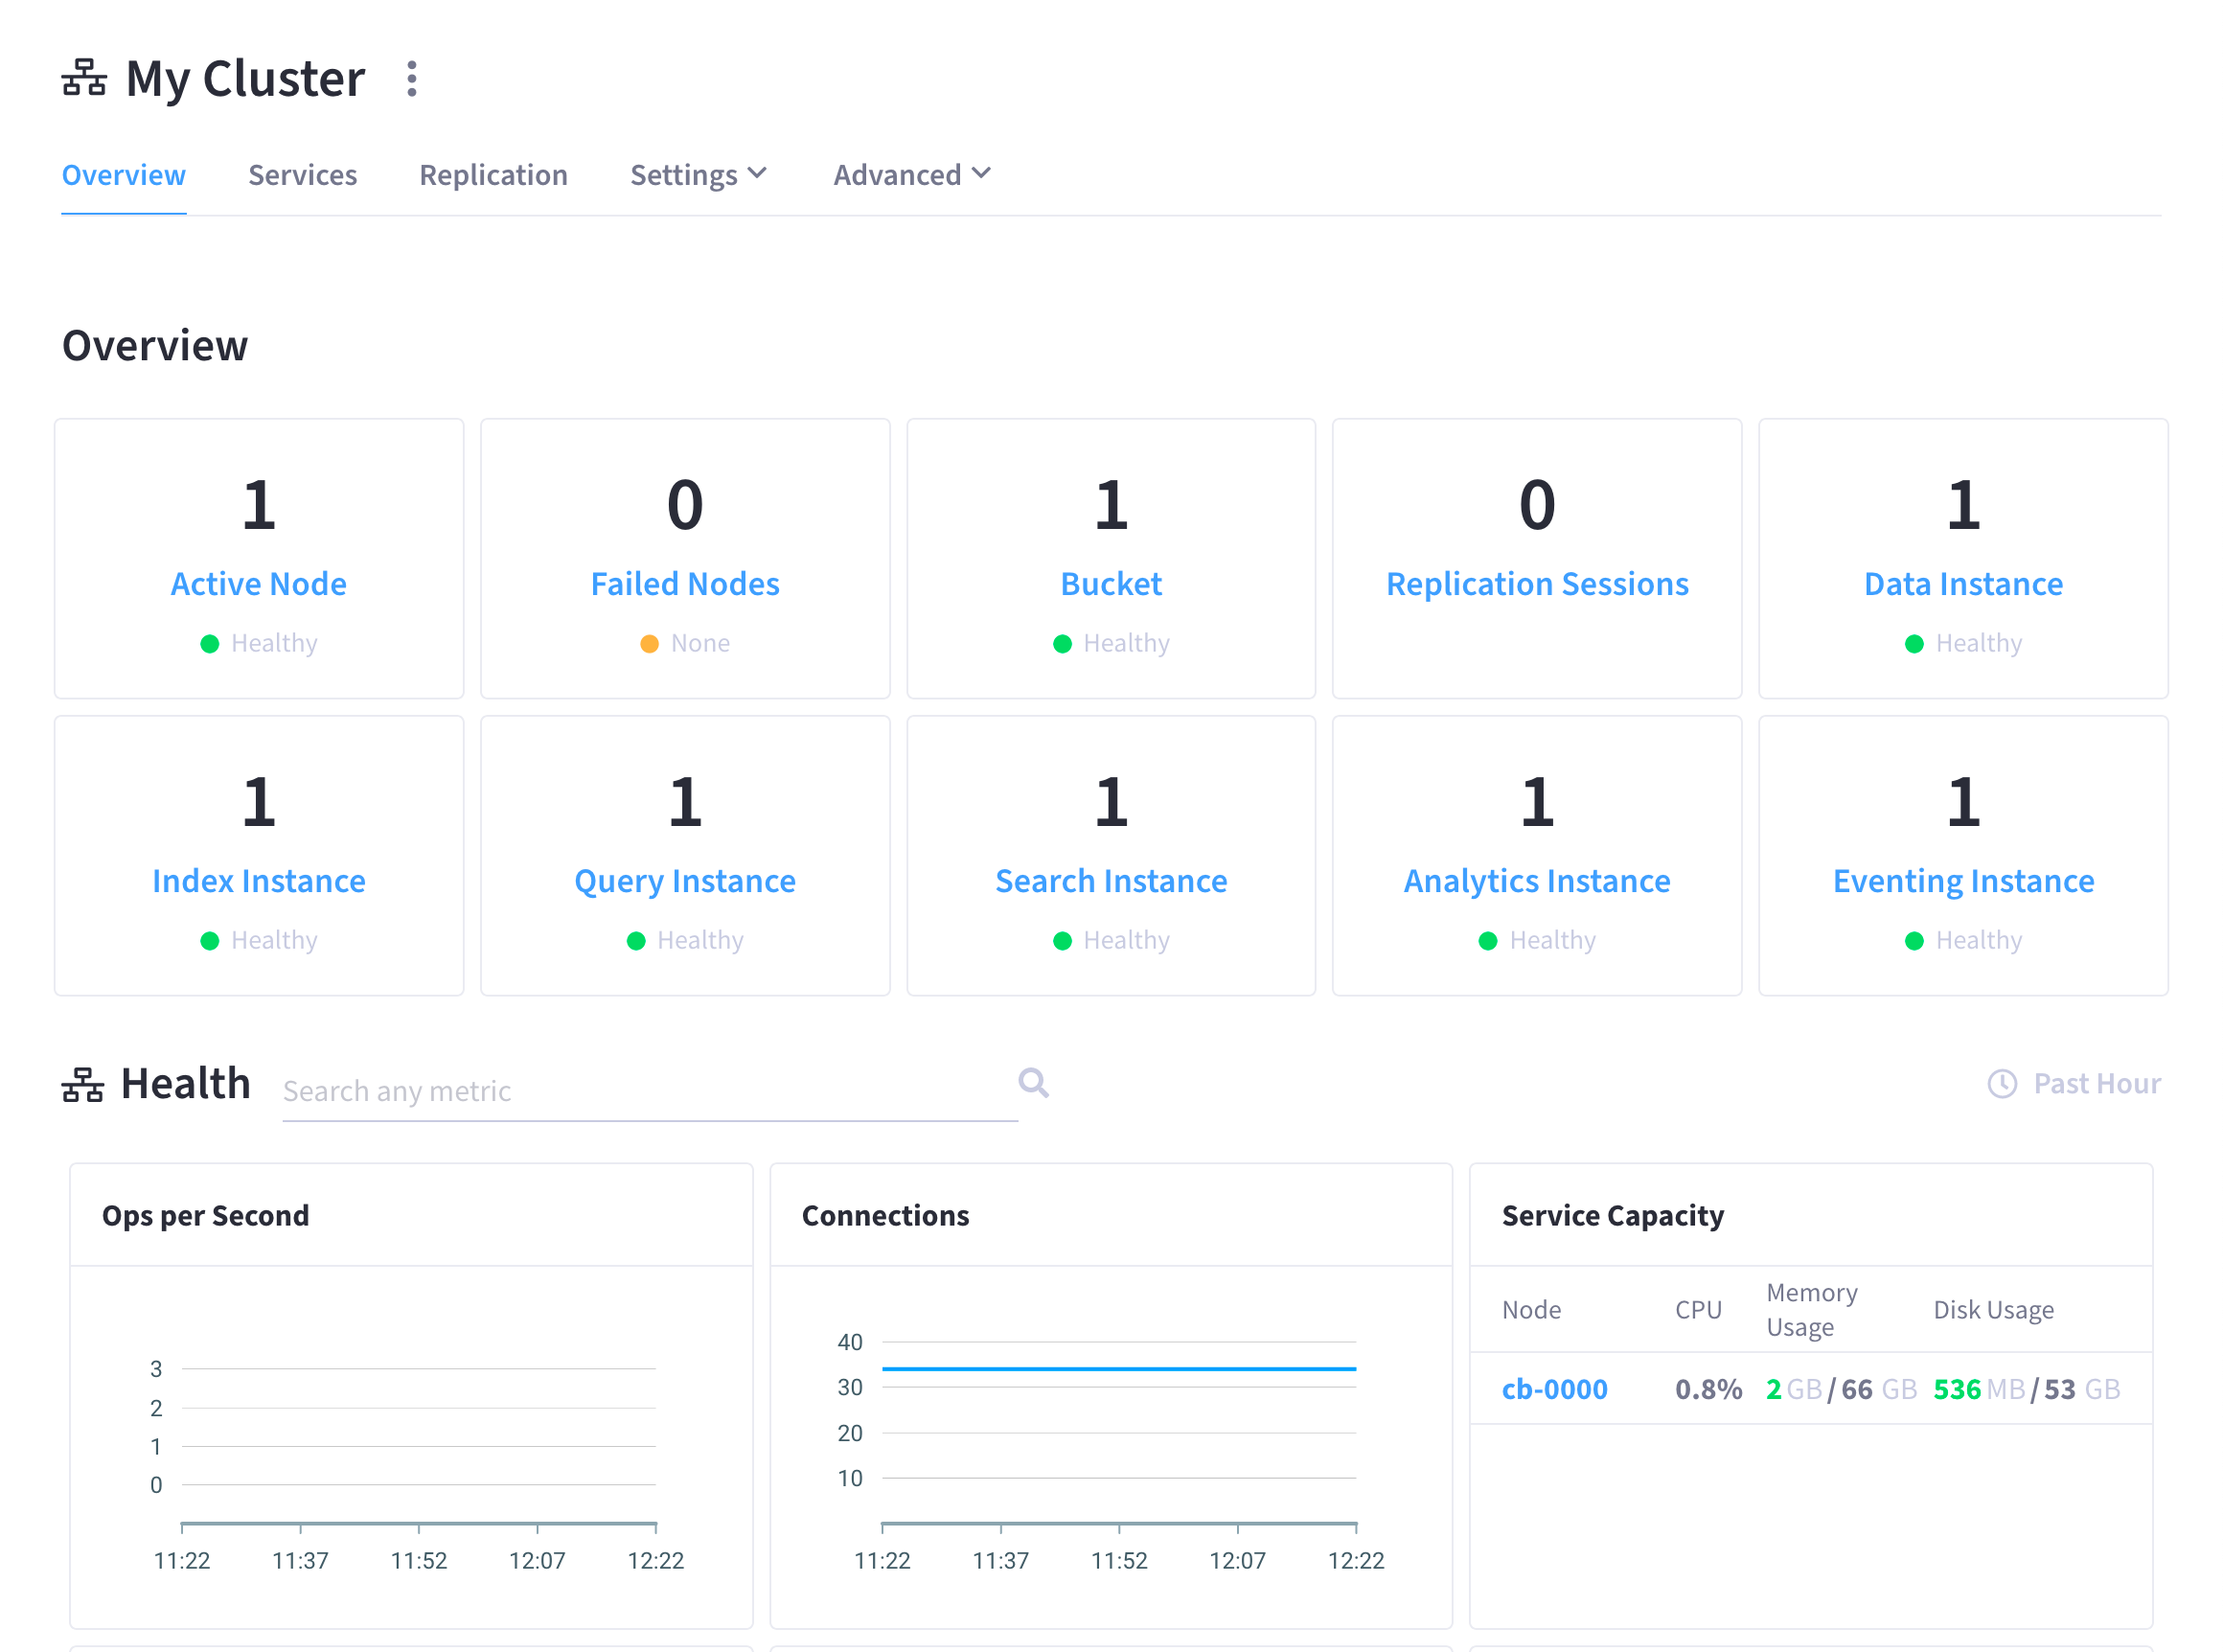
Find and click on your cluster.
This opens the cluster’s Overview tab:
-
Go to the Advanced > Indexes tab.
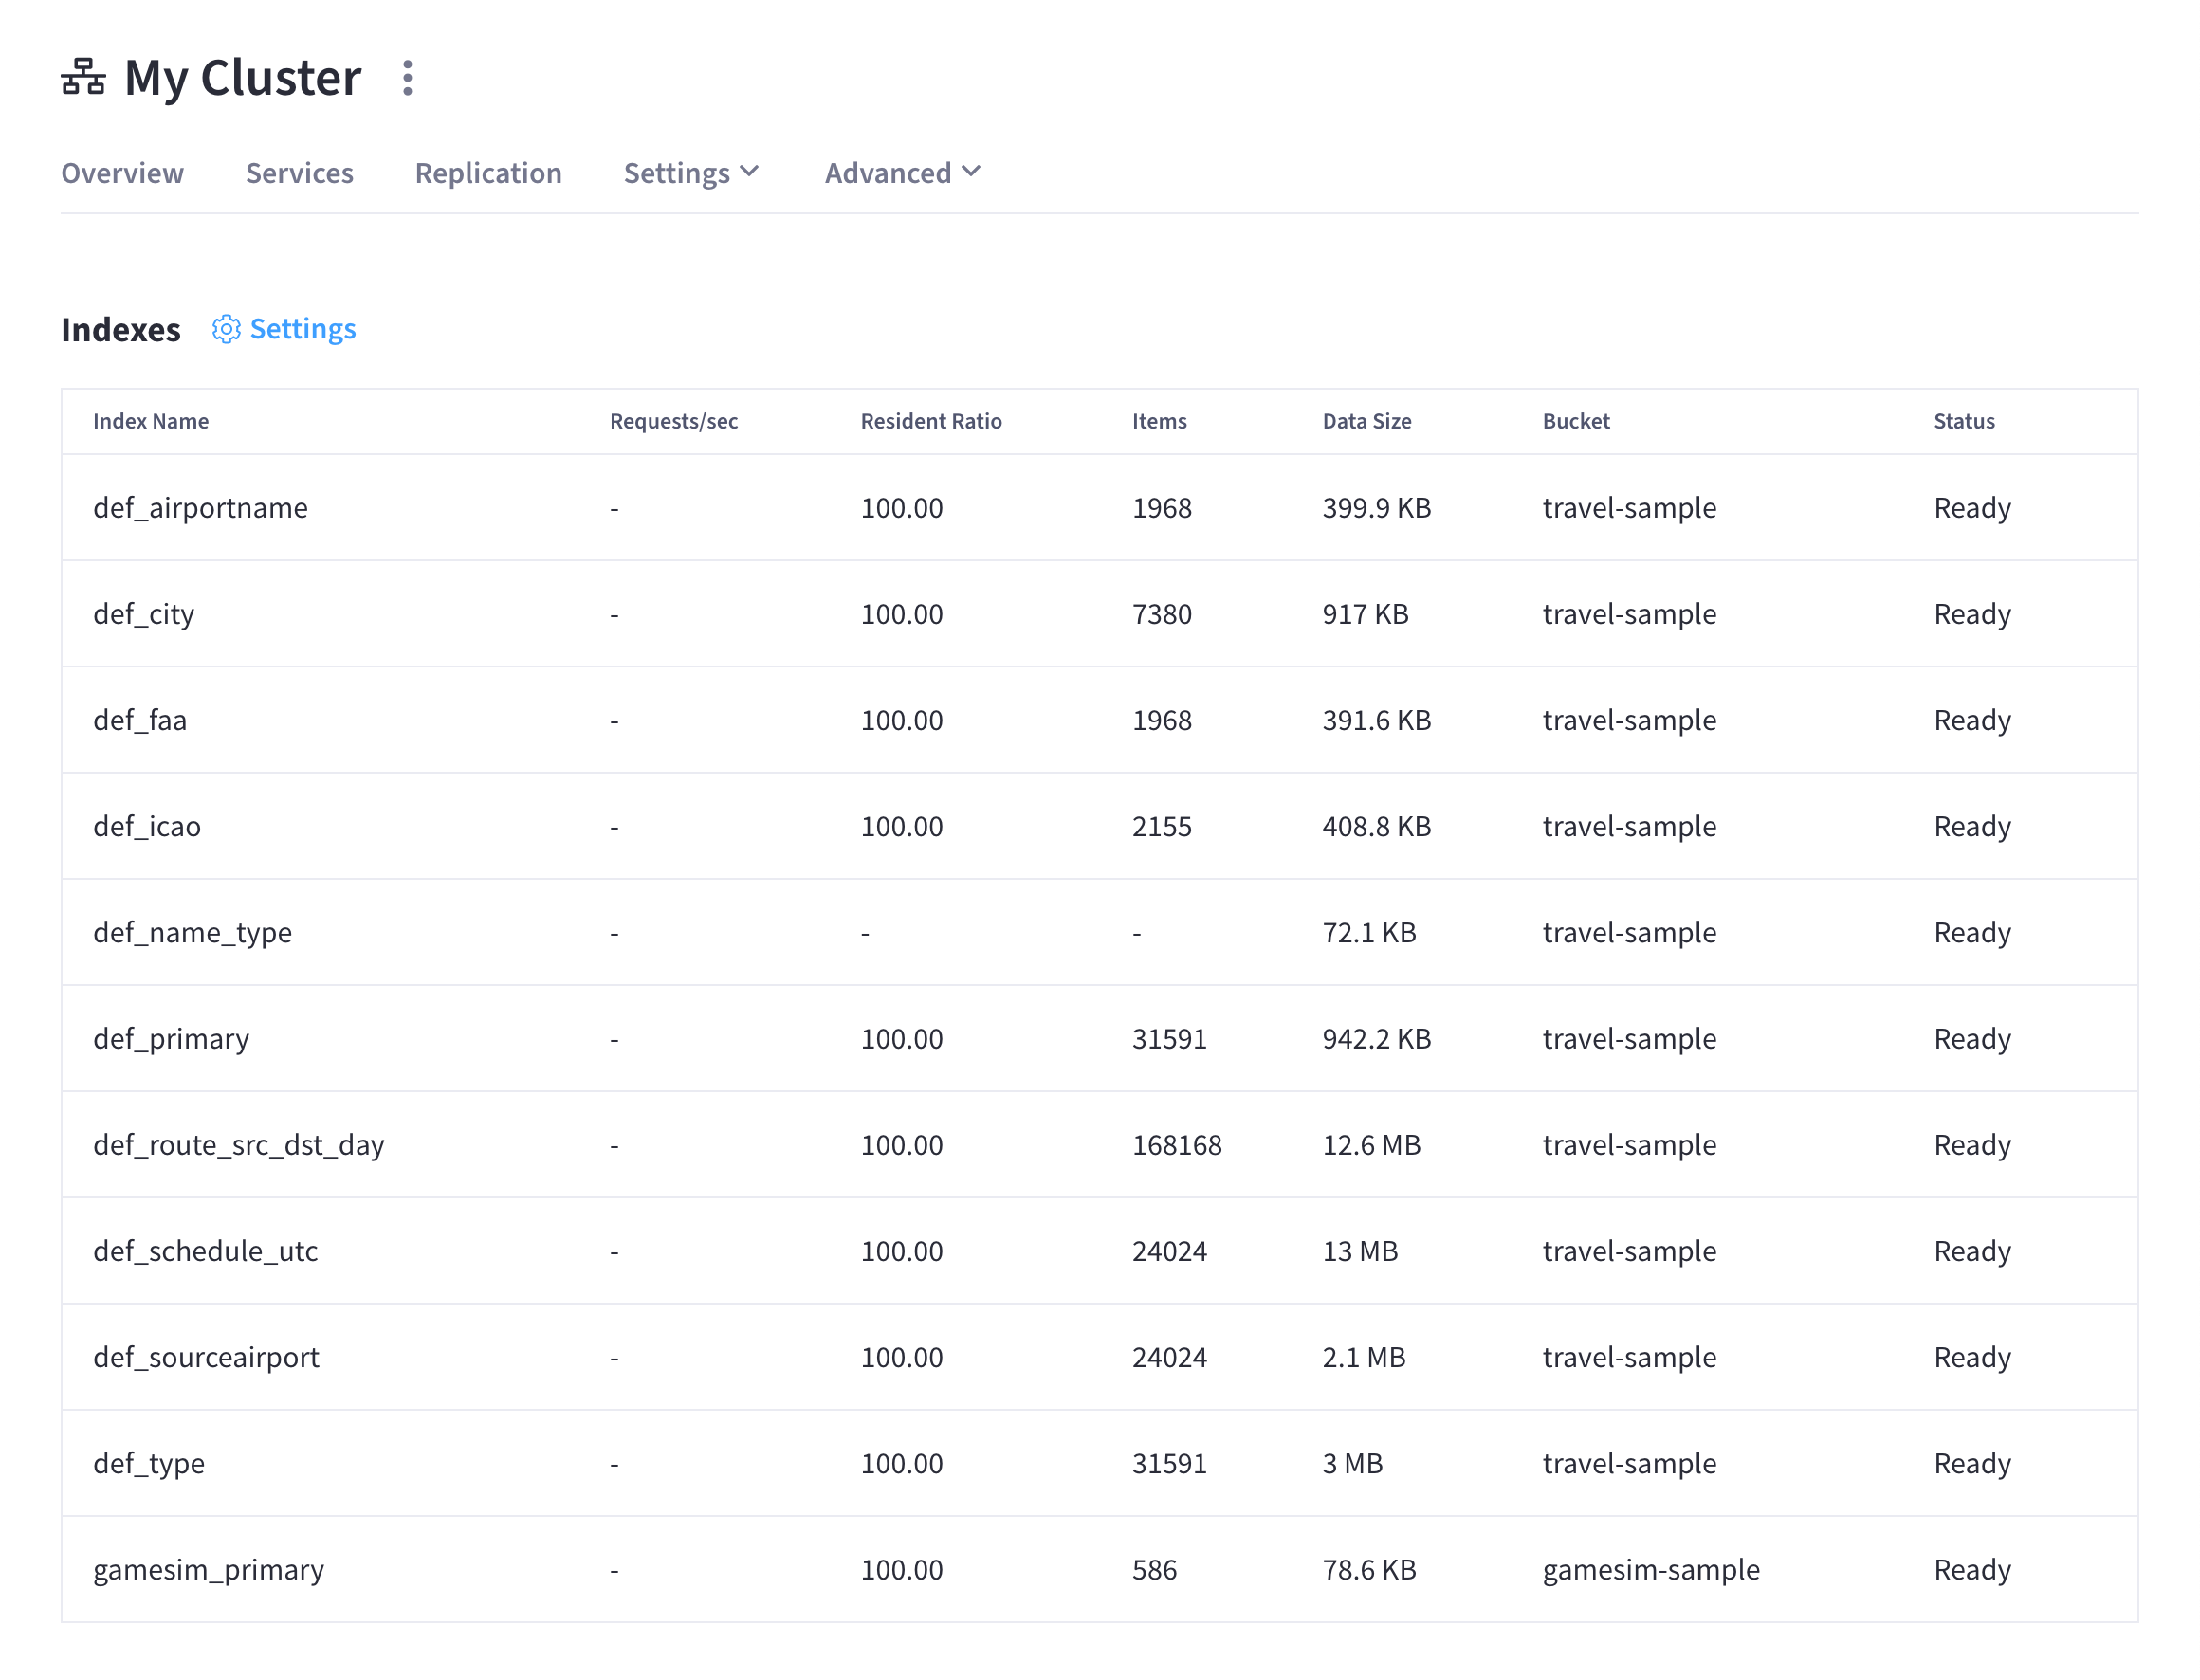
Index Summary
The index list displays the following information about each index:
- Index Name
-
The name of the index or replica.
- Requests/sec
-
The number of requests per second.
- Resident Ratio
-
The percentage of the data held in memory.
- Items
-
The number of items currently indexed.
- Data Size
-
The size of indexable data that is maintained for the index or replica.
- Bucket
-
The bucket for which the index or replica was created.
- Status
-
The current state of the index service on the node on which this index is stored: ready, pause, or warmup.
Inspect an Index
Clicking on an index row opens that index’s fly-out menu:
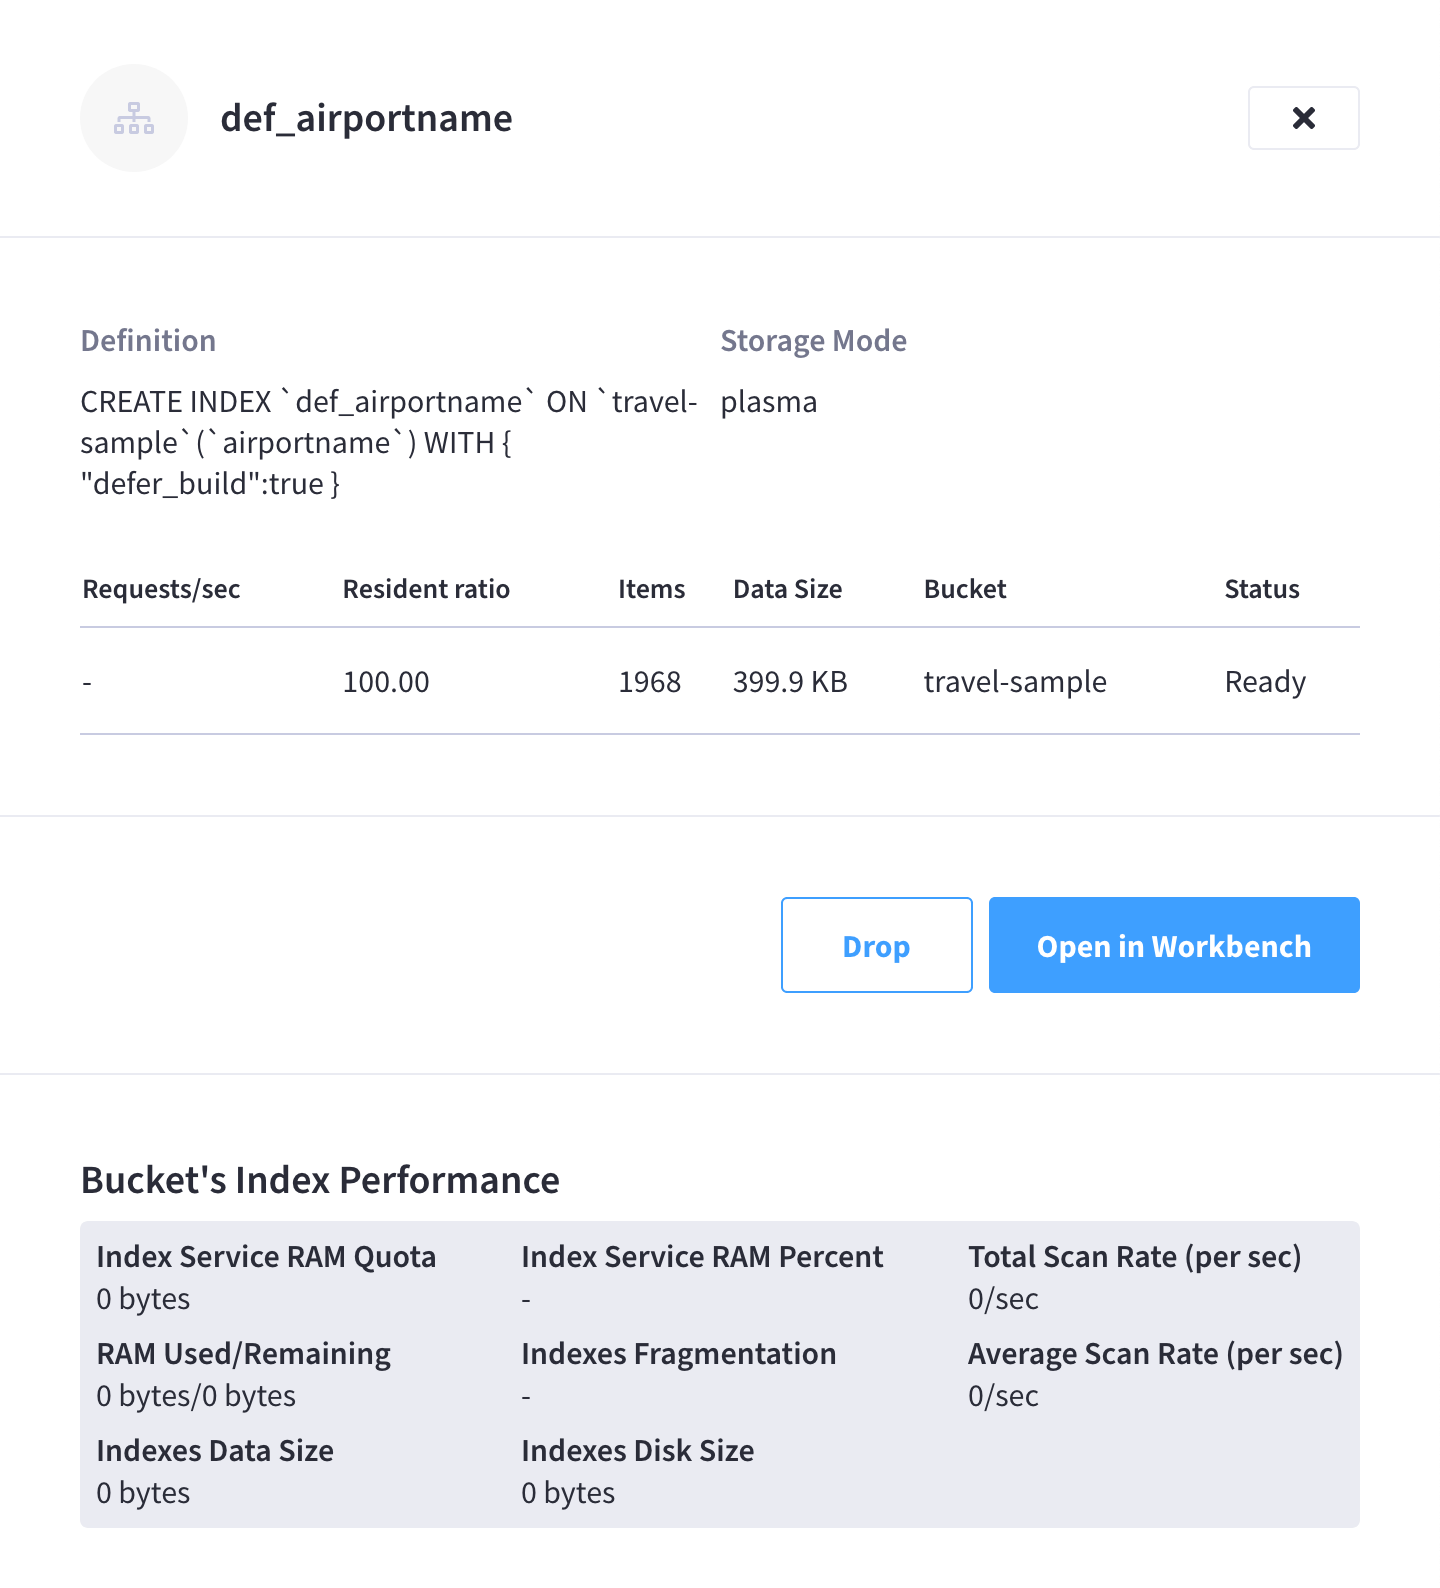
The following details are displayed at the top of the fly-out menu:
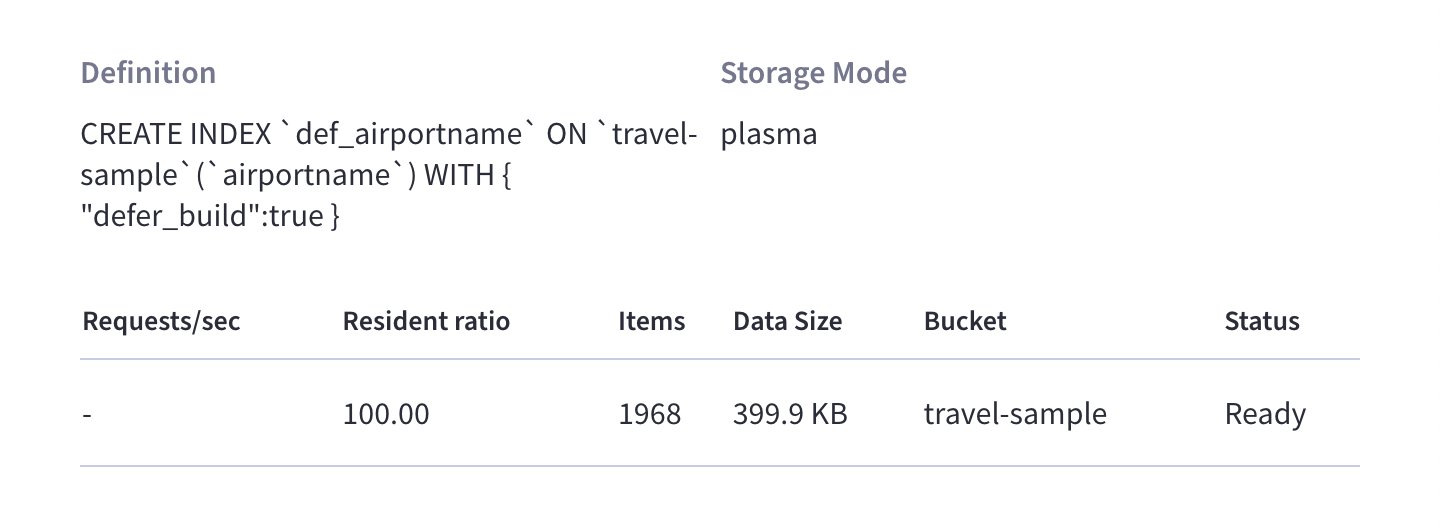
- Definition
-
The N1QL statement used to define the index.
- Storage Mode
-
The storage mode used by the index service on the node on which this index is stored.
The details from the index list are also re-displayed here.
Open the Index Definition
Click Open in Workbench to open the index definition in the Query Workbench.
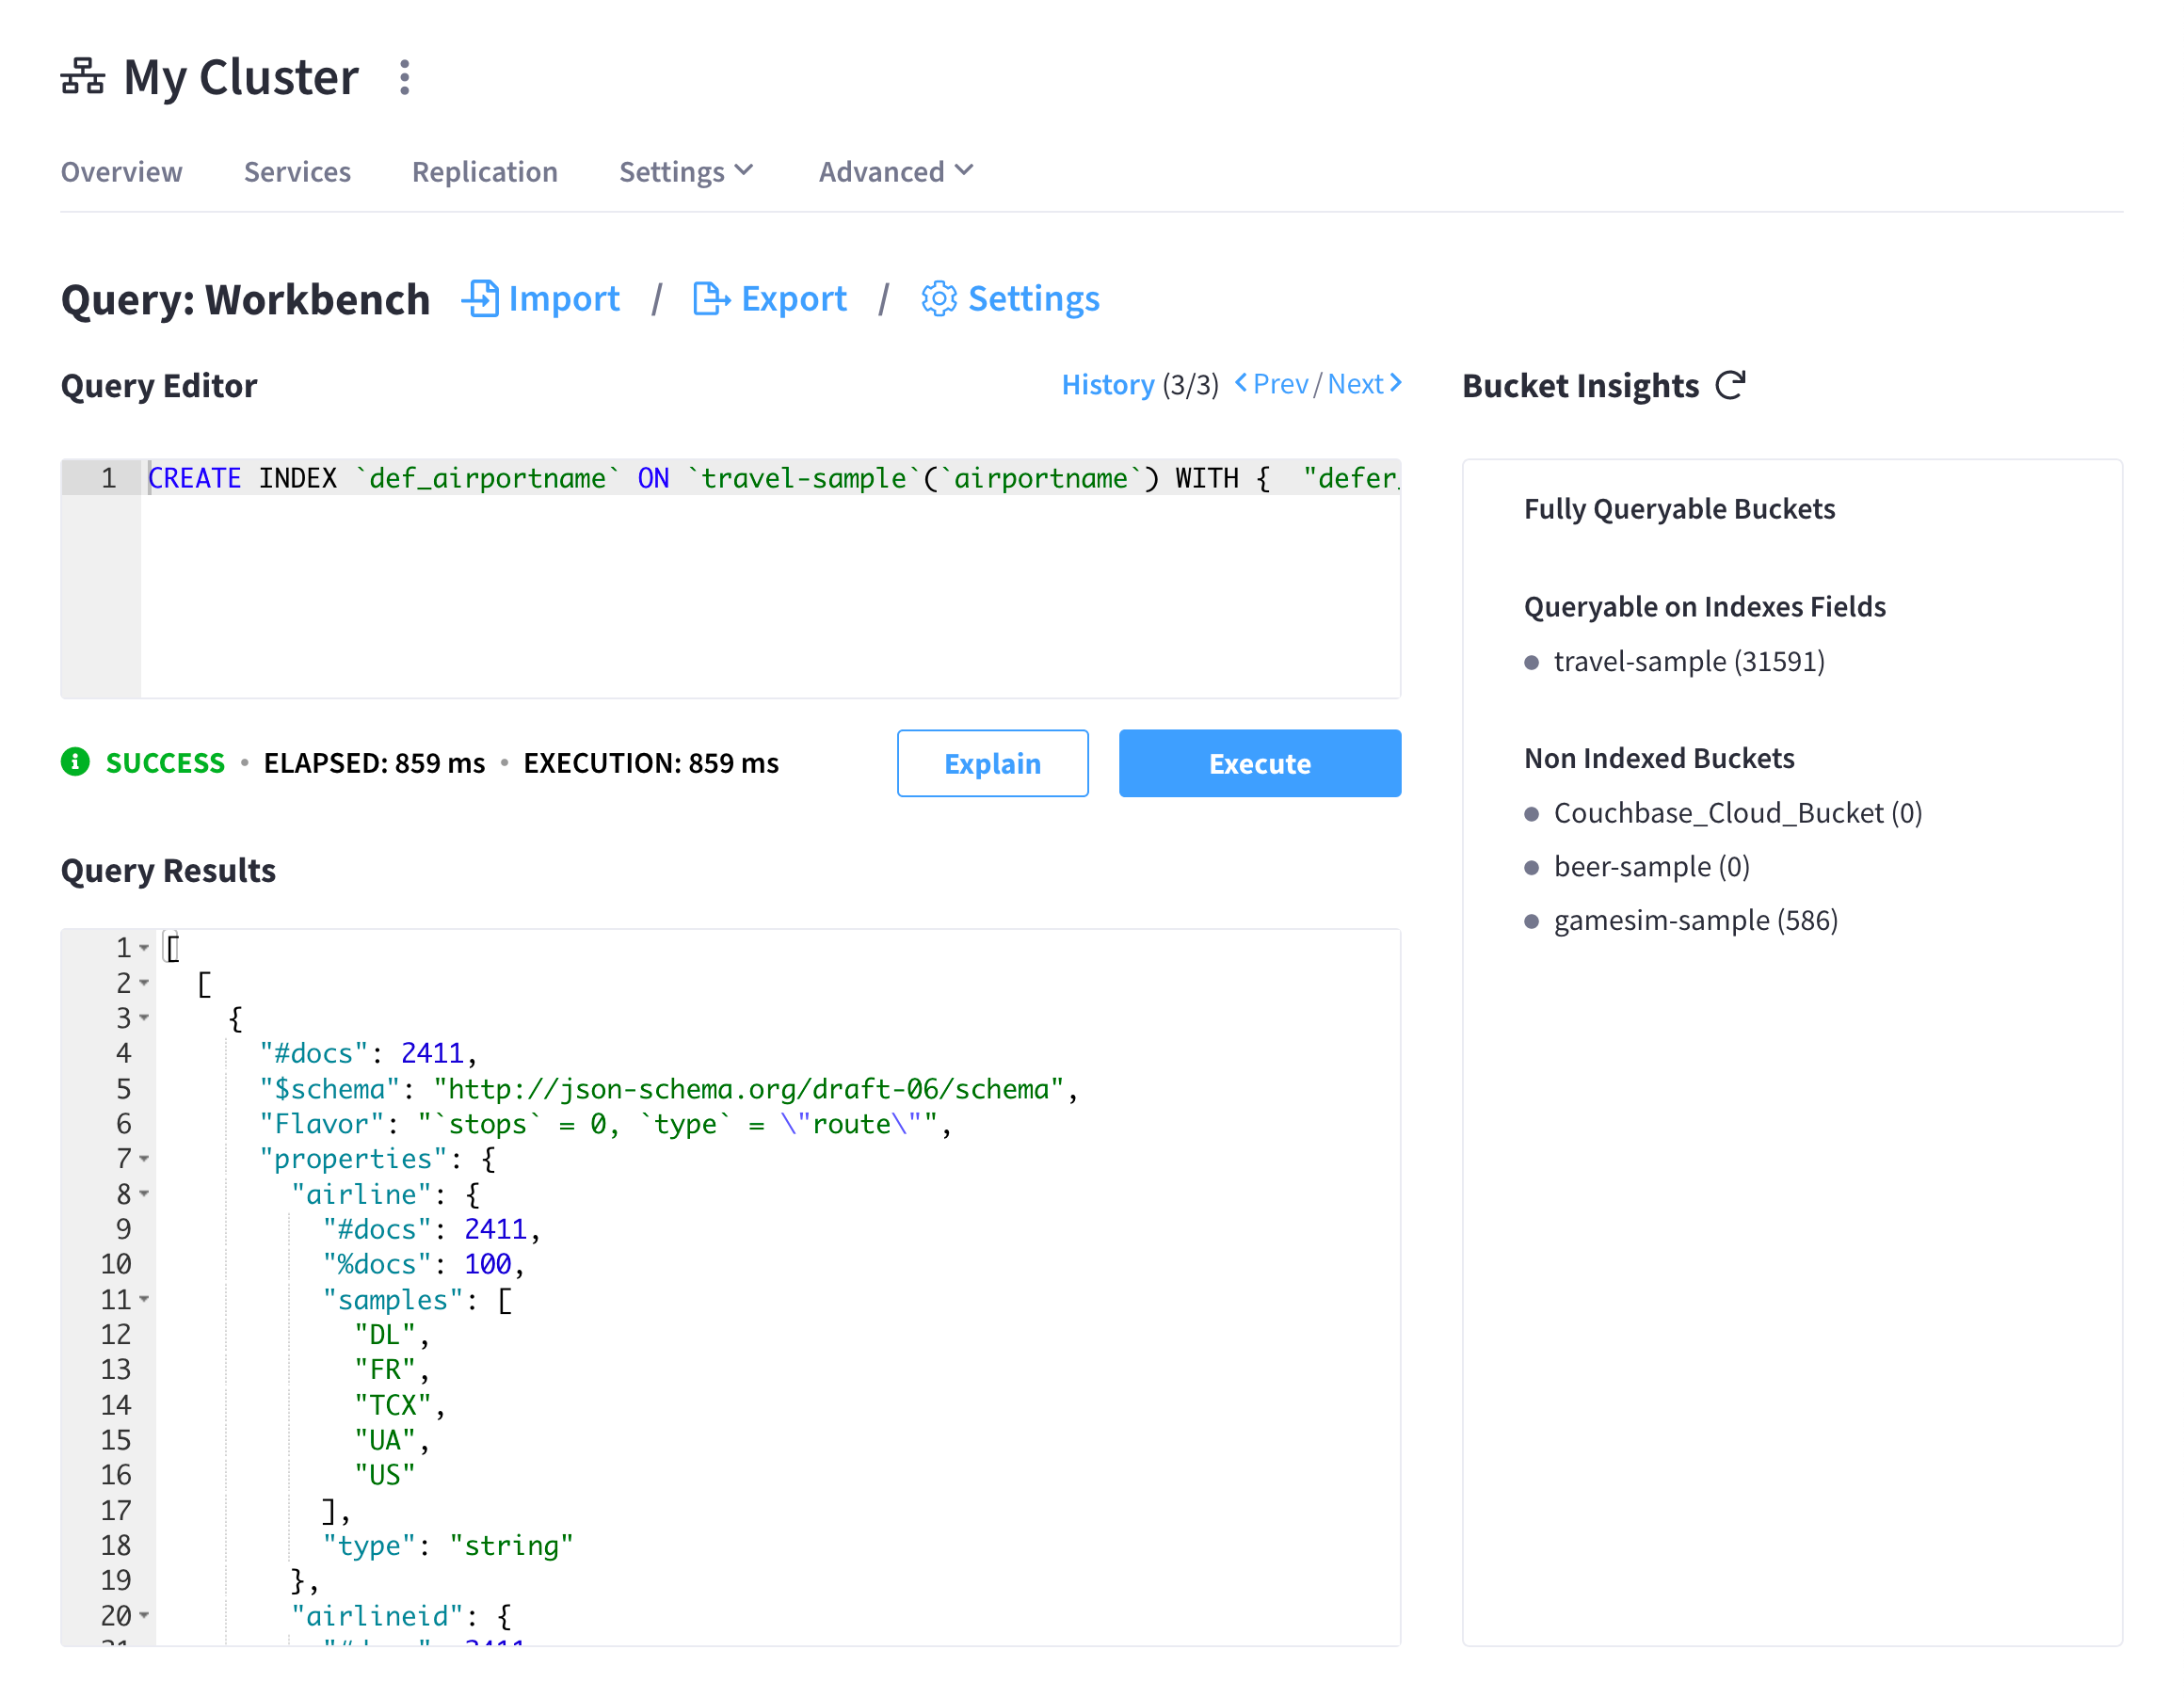
The index definition is loaded into the Query Editor and executed, with results shown in the Query Results panel. From here you can modify the index definition in order to create a new index. (You cannot change the definition of the existing index, but you can create a new index with the modified definition.)
Drop the Index
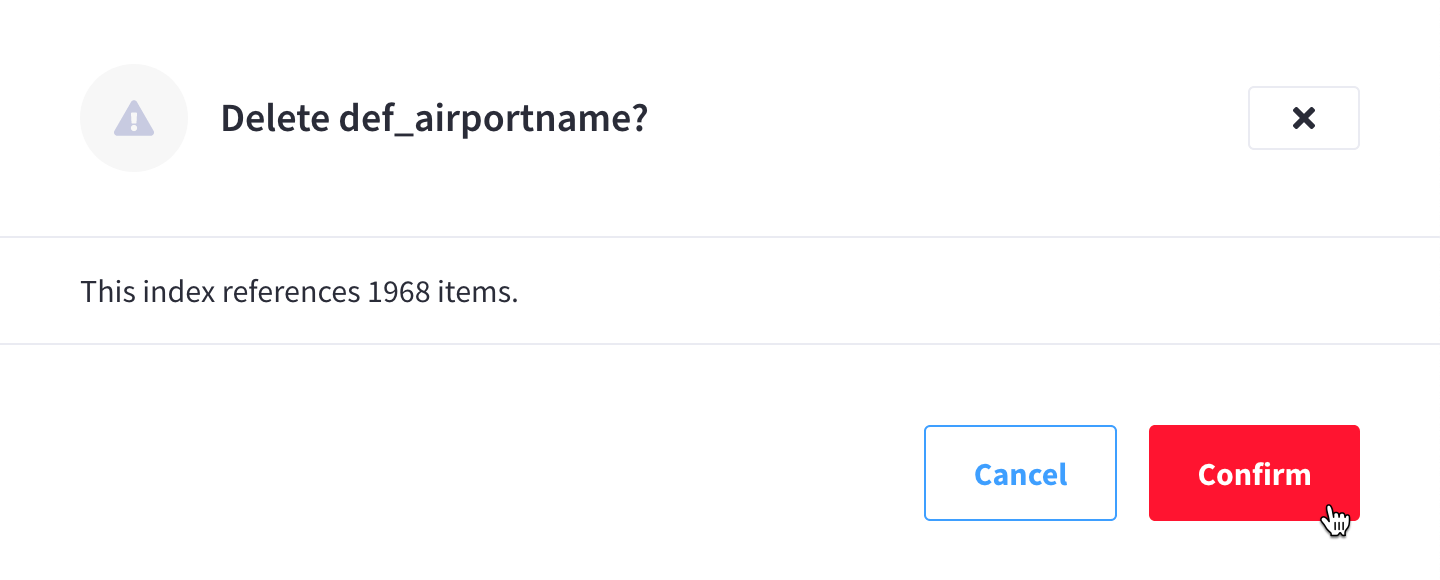
You can drop the index by clicking Drop. When prompted to confirm the deletion, click Confirm to drop the index.
| You can also drop an index using the N1QL DROP INDEX or DROP PRIMARY INDEX commands. |
Index Performance
The Bucket’s Index Performance panel displays general statistics for the index service.
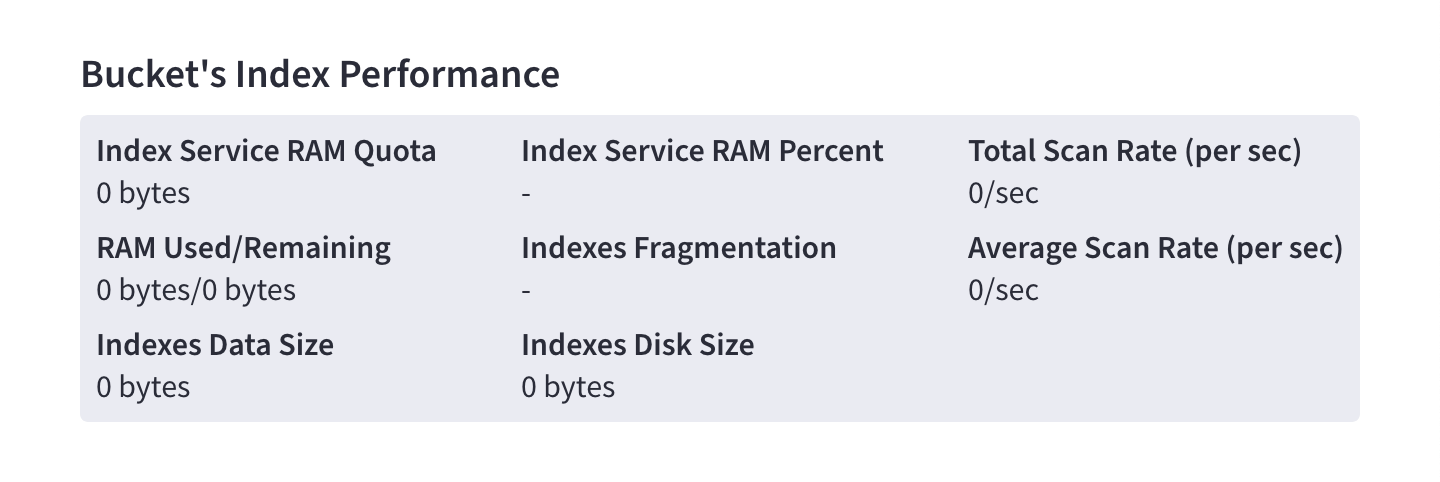
The following statistics apply to the Index Service as a whole:
- Index Service RAM Quota
-
The buffer cache size for the index service across all nodes.
- RAM Used/Remaining
-
The amount of memory used by the index service, and the remaining amount of memory available to the index service.
- Index Service RAM Percent
-
The amount of memory used by the index service, as a percentage of the amount of memory available to the index service.
The following statistics apply to the bucket that the index is defined on:
- Total Scan Rate
-
The number of index items scanned by the index service per second for the selected bucket.
- Indexes Fragmentation
-
The percentage fragmentation of all indexes for the selected bucket. This indicates the percentage of disk space consumed by the indexes, but not utilized for items stored in the indexes.
- Indexes Data Size
-
The actual data size consumed by all indexes for the selected bucket.
- Indexes Disk Size
-
The total disk file size consumed by all indexes for the selected bucket.
Index Settings
Clicking Settings opens the Index Settings fly-out menu, which contains multiple settings for configuring the Index Service.
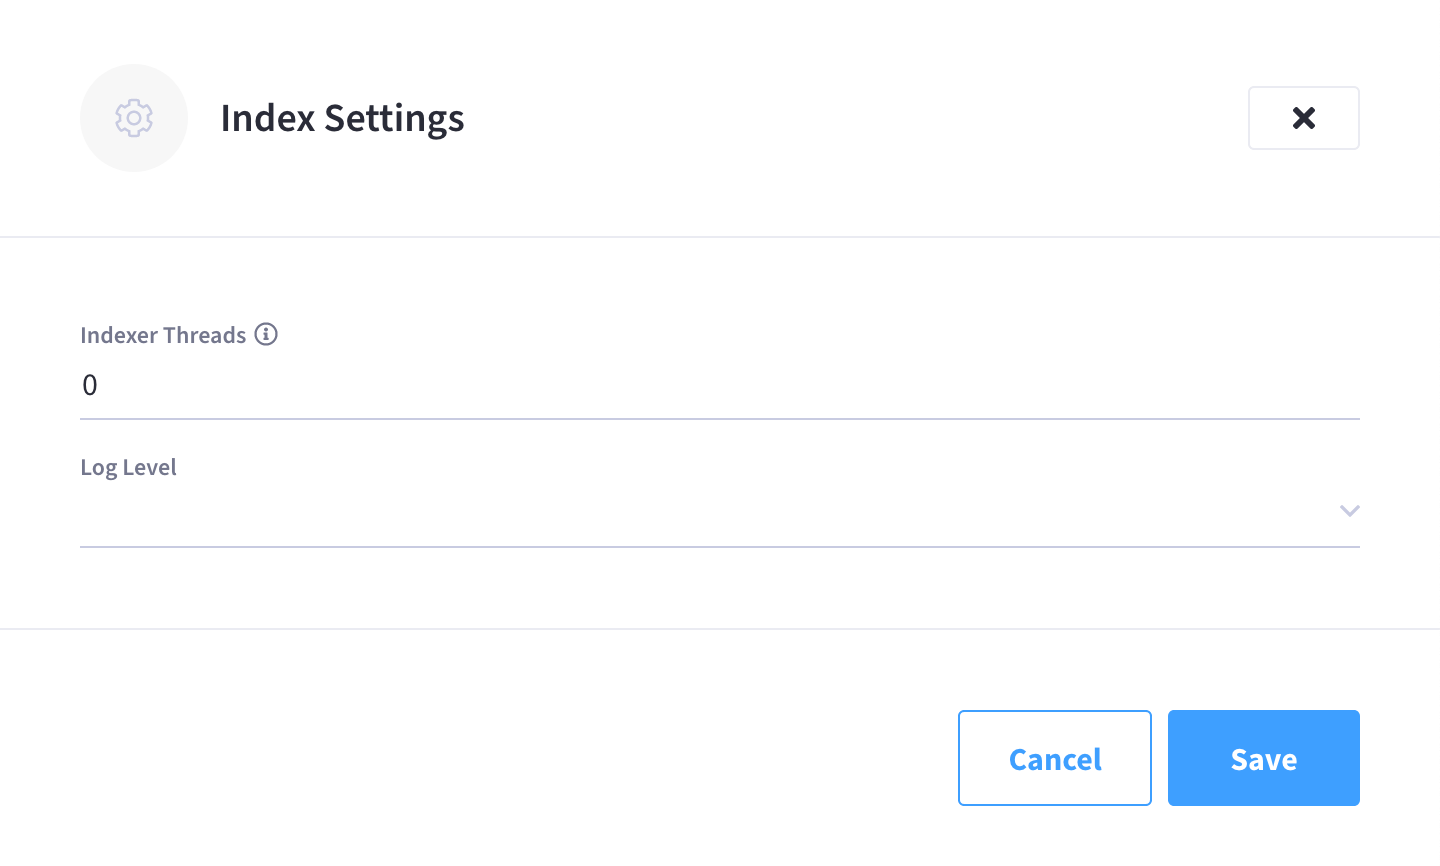
The following settings are available:
- Indexer Threads
-
The number of dedicated threads used by the Index Service. The number can be increased on multi-core machines. The default is 0.
- Log Level
-
Adjust the logging level. The options are:
Silent,Fatal,Error,Warn,Info,Verbose,Timing,Debug, andTrace. The default isInfo.
Click Save to save any configuration changes to the above settings.